(7 votes, average: 4.43 out of 5)
Organizations must deliver and operate software quickly and reliably to meet the demands of an ever-changing industry. The faster your teams can make changes to your software, the sooner you can deliver value to your customers, run experiments, and receive valuable feedback.
With seven years of data collection and research, DORA has developed and validated four metrics that measure software delivery performance. In this blog post, we’ll explain what DORA metrics are and how they can help your organization deliver faster and better. We’ll also outline why, at Pentalog, we’ve integrated these metrics into our Maturity Models.

What is DORA?
DORA stands for DevOps Research and Assessment, a research firm acquired by Google in December 2018. They aim to help achieve high DevOps and organizational performance with data-driven insights.
DORA’s research program is the longest-running academically rigorous research investigation of its kind and includes data and research from over 32,000 global professionals worldwide over seven years. Their extensive research uses ‘Behavioral science to identify the most effective and efficient ways to develop and deliver software.’
Notably, the DORA research program provides an independent view into what practices and behaviors drive high performance in technology delivery and impact organizational outcomes.
You can read more about their journey here.
What are DORA Metrics?
So, how do you understand and assess the performance of your software development team? Helpfully, the DORA team has ascertained four key metrics to help you identify performance:
- Deployment Frequency — This metric focuses on how often an organization successfully releases to production.
- Lead Time for Changes — In this area, DORA looks at the amount of time it takes a commit to get into production.
- Change Failure Rate — By focusing on this metric, you can see the percentage of deployments causing a production failure.
- Time to Restore Service — And finally, DORA identifies how long it takes to recover from a failure in production.
To look at these metrics in further detail, they can be broken down into measuring stability and velocity. In this instance, the metrics measure stability using Change Failure Rate and Time to Restore Service, and velocity using Deployment Frequency and Lead Time for Changes.
And why are these useful to your organization specifically? Because by measuring these areas and continuously improving them, your team can improve their business outcomes. For example, DORA uses these to measure and identify Low-performing, Medium, High and Elite teams. They found that Elite teams are ‘Twice as likely to meet or exceed their organizational performance goals.’ Now that is certainly worth considering!
Therefore, by using these metrics to assess your organization’s performance, you should ideally be able to improve your operations’ efficiency and effectiveness.
What are the benchmarking levels for the DORA Metrics?
According to the conjoined Google & DORA’s latest State of DevOps 2021, they are the following:
| DORA Metrics | LOW | MEDIUM | HIGH | ELITE |
|---|---|---|---|---|
| Deployment frequency
How often does your organization deploy code to production or release it to end users? |
Fewer than once per six months | Between once per month and once every six months | Between once per week and once per month | On-demand (multiple deploys per day) |
| Lead time for changes
What is your lead time for changes (i.e., how long does it take to go from code committed to code successfully running in production)? |
More than six months | Between one month and six months | Between one day and one week | Less than one hour |
| Time to restore service
For the primary application or service you work on, how long does it generally take to restore service when a service incident or a defect that impacts users occurs (e.g., unplanned outage or service impairment)? |
More than six months | Between one day and one week | Less than one day | Less than one hour |
| Change failure rate
What percentage of changes to production or released to users result in degraded service (e.g., lead to service impairment or service outage) and subsequently require remediation (e.g., require a hotfix, rollback, fix forward, patch)? |
16%-30% | 16%-30% | 16%-30% | 0%-15% |
How do the DORA metrics contribute to better software delivery?
DORA metrics provide teams with a framework for measuring their software delivery performance and making data-driven decisions to optimize their processes.
How do they translate into advantages for your tech team? Here is an overview:
- By tracking deployment frequency, teams can ensure they are releasing updates to users more frequently, which can lead to faster feedback and a better user experience.
- By measuring the lead time for changes, teams can identify bottlenecks in their development and delivery processes and work to streamline their workflows.
- By monitoring the time to restore service, teams can identify areas where they need to improve their resilience and response to incidents.
- And by tracking the change failure rate, teams can identify areas where they need to improve their testing and quality assurance processes.
DORA Metrics and Pentalog Maturity Models
At Pentalog, we are constantly working to achieve greatness and continuously using and adapting to industry standards to achieve operational excellence for our projects. Maturity Models are a great example of this. They cumulate best practices across several areas, aiming to achieve the highest level, working with our clients to get there in the most optimal way, all while offering complete visibility of the entire status and process.
We considered the benefits for our customers of having visibility of the DORA Metrics and helping our customers achieve a higher level on this. So, starting today, the DORA Metrics have been implemented on the Infrastructure & DevOps section of our Maturity Models in the following way:
- We introduced the requirement to have visibility over the DORA Metrics status for any project under the Almost Good column.
- We correlated the High and Elite levels of the Dora Metrics with the Good and Very Good columns of our Infrastructure & DevOps section.
This way, our clients will have a fully transparent picture of where they stand according to the DORA metrics, which ultimately means how efficient and reliable their software delivery process is. Then we can consult and build a roadmap to achieve the optimal level for our customers for each metric.
Key takeaways
DORA metrics provide a powerful tool that helps teams streamline collaboration and alignment, benchmark performance, and focus on continuous improvement.
By focusing on key areas of performance and providing an objective way to measure progress, teams can deliver software faster, with higher quality and reliability, and ultimately make better decisions make about resource allocation, process improvement, and technology investments.
BONUS – How to automatically measure the data for a project using GCP (Google Cloud Platform)?
Google provides a tool called four keys (you can find the repository here).
Besides using GCP, the requirements are quite simple as you just need to have:
- The project on GitHub or GitLab
- A project which has deployments (not libraries, for example)
If all is met, the setup is quite simple: fork the repo, run the automation scripts, and set up your dev envs to send events to the webhooks created.
It will then work like this:
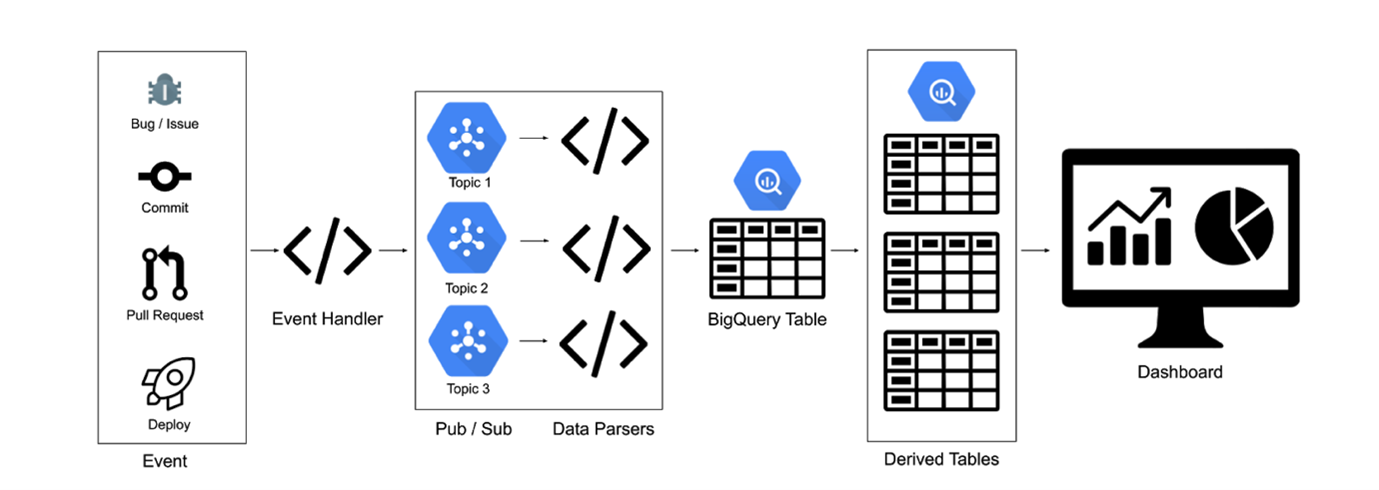
- Firstly, events are sent to a webhook target. This is hosted on Cloud Run.
- According to GitHub, events can be defined as ‘Any occurrence in your development environment (for example, GitHub or GitLab) that can be measured, such as a pull request or a new issue.’
- To help you, Four Keys will highlight the events to measure, and then depending on your project, you can add relevant others.
- Then, all events will be published to Pub/Sub (using the Cloud Run target).
- Next, the data is input into BigQuery. As described by GitHub, ‘A Cloud Run instance is subscribed to the Pub/Sub topics, does some light data transformation, and inputs the data into BigQuery.’
- Finally, to complete the data transformations, you’ll find the BigQuery view, which feeds into the dashboard.
You can find more information using The Four Keys system, as shown in the diagram below: